LIVE MARKET PRODUCT
PUBLIC PRODUCT / ONLINECreator & Product Lead
DUSD.fun
Making deflation visible.
A live market-intelligence product tracking supply contraction, burn activity and the evolving monetary story of a community-run token on Solana.
View DUSD.fun ↗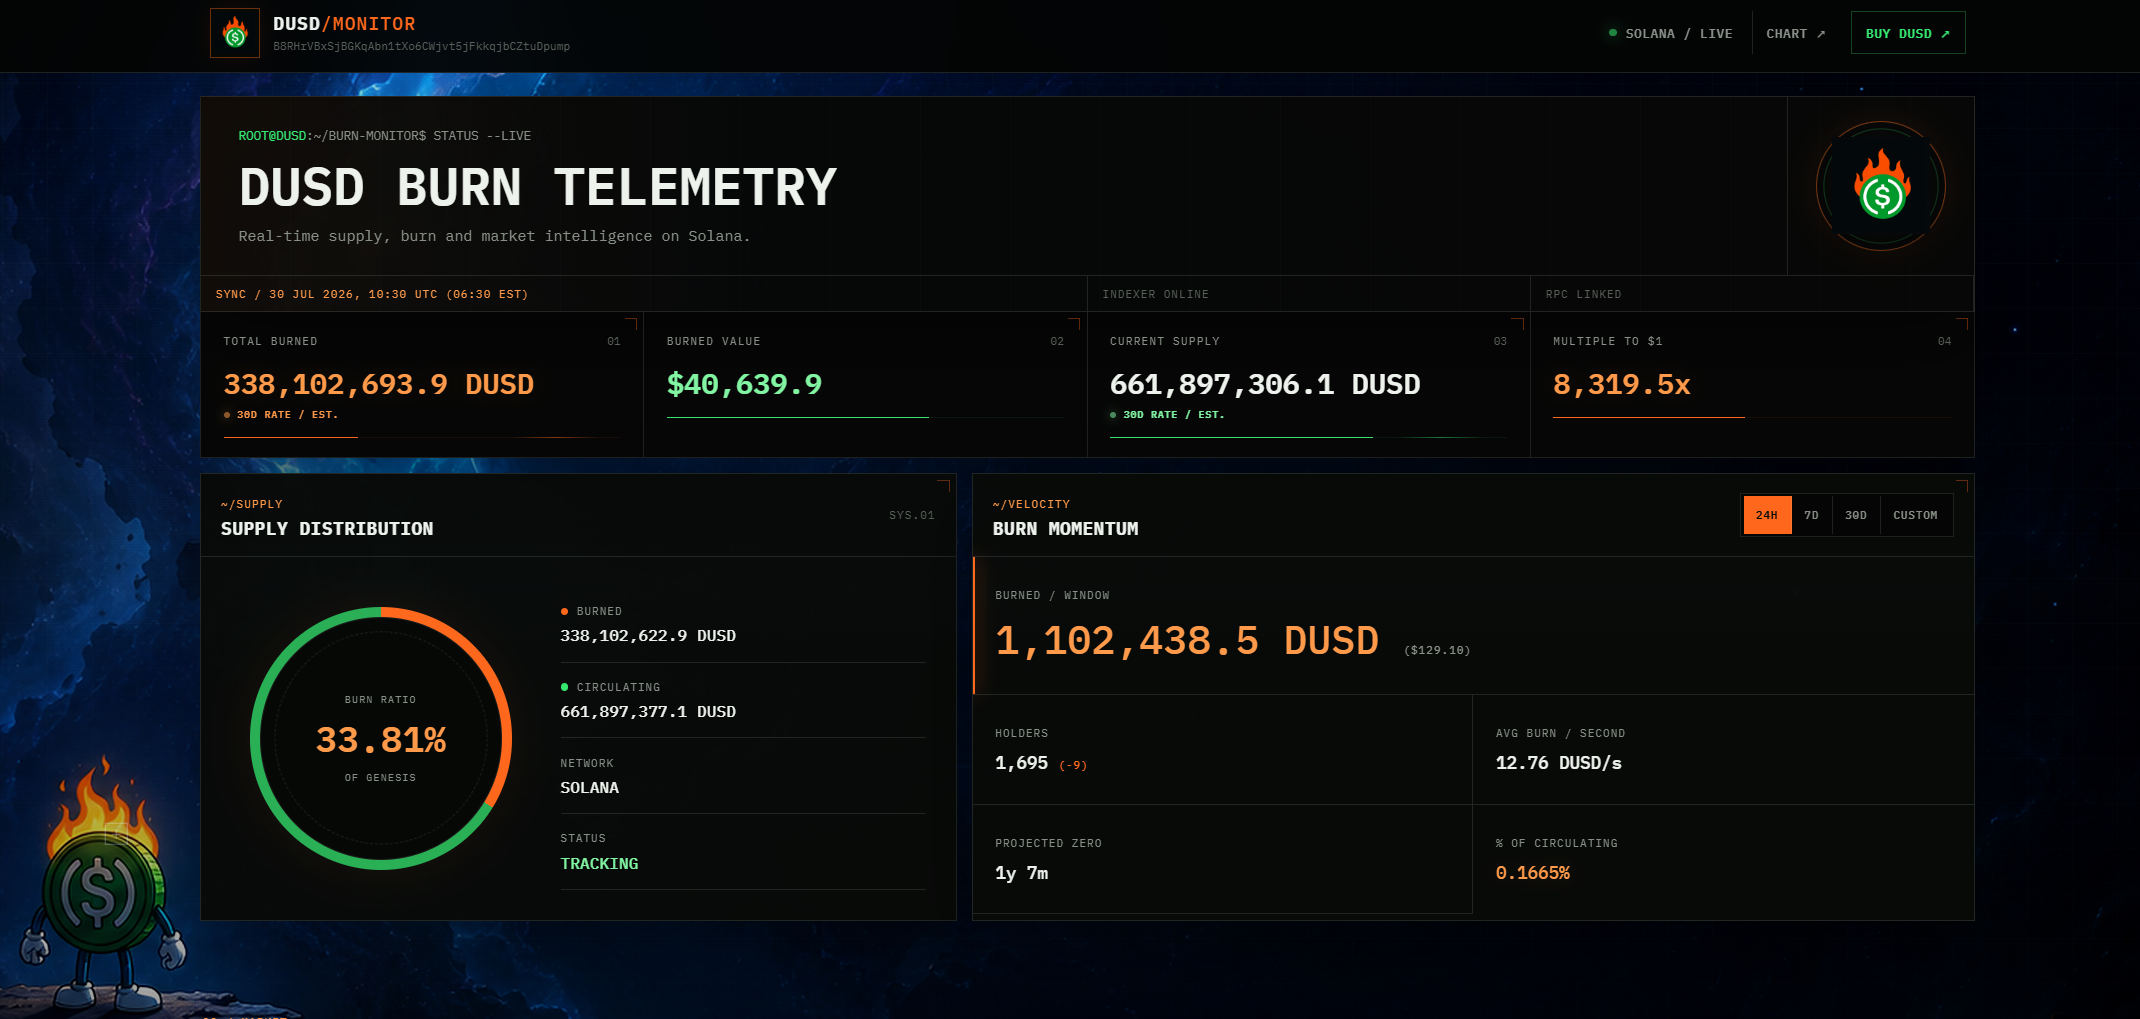
Live supply, burn and market telemetry derived from on-chain and market data.
THE OPPORTUNITY
A joke with a serious system underneath
DUSD uses trading activity to fund recurring buybacks and permanent token burns. Every burn reduces the outstanding supply.
The original mechanism was simple, but the public experience around it was fragmented. There was no clear destination showing how much supply had been destroyed, how quickly burns were occurring, what remained, how the mechanism compared with other monetary systems, or which transactions were driving the change.
DUSD can be read as both a memecoin and an experiment in mechanically contracting digital supply. I designed DUSD.fun to make that system legible without pretending the experiment was already an established monetary asset.
A burn transaction is only raw blockchain activity until it is turned into an understandable product experience.
The product does not ask users to believe the narrative. It lets them inspect the mechanism.
WHAT I BUILT
Product, data and narrative in one system
The public website combines telemetry, market intelligence, monetary comparison and interactive tools inside one information architecture.
Live telemetry
- Supply burned
- Circulating supply
- Burn value and velocity
- Holder and market information
- Supply movement
- Transaction feed
Market intelligence
- Price and liquidity
- Volume and trading activity
- Interactive time windows
- Market charts
- Trading pathways
Monetary comparison
- DUSD supply contraction
- Bitcoin issuance
- Gold production
- US M2 expansion
- Indexed supply curves
- DUSD relative to US M2
Interactive product tools
- Monetary-scale comparisons
- Market-cap parity scenarios
- Position calculator
- Live burn ledger
- Community pathways
I owned the product strategy, information architecture, design direction, data presentation and implementation of the entire public website.
THE LIVE PRODUCT
A market terminal for a shrinking supply
Real product evidence from the public interface. Values shown belong to the captured product state; visit DUSD.fun for current information.
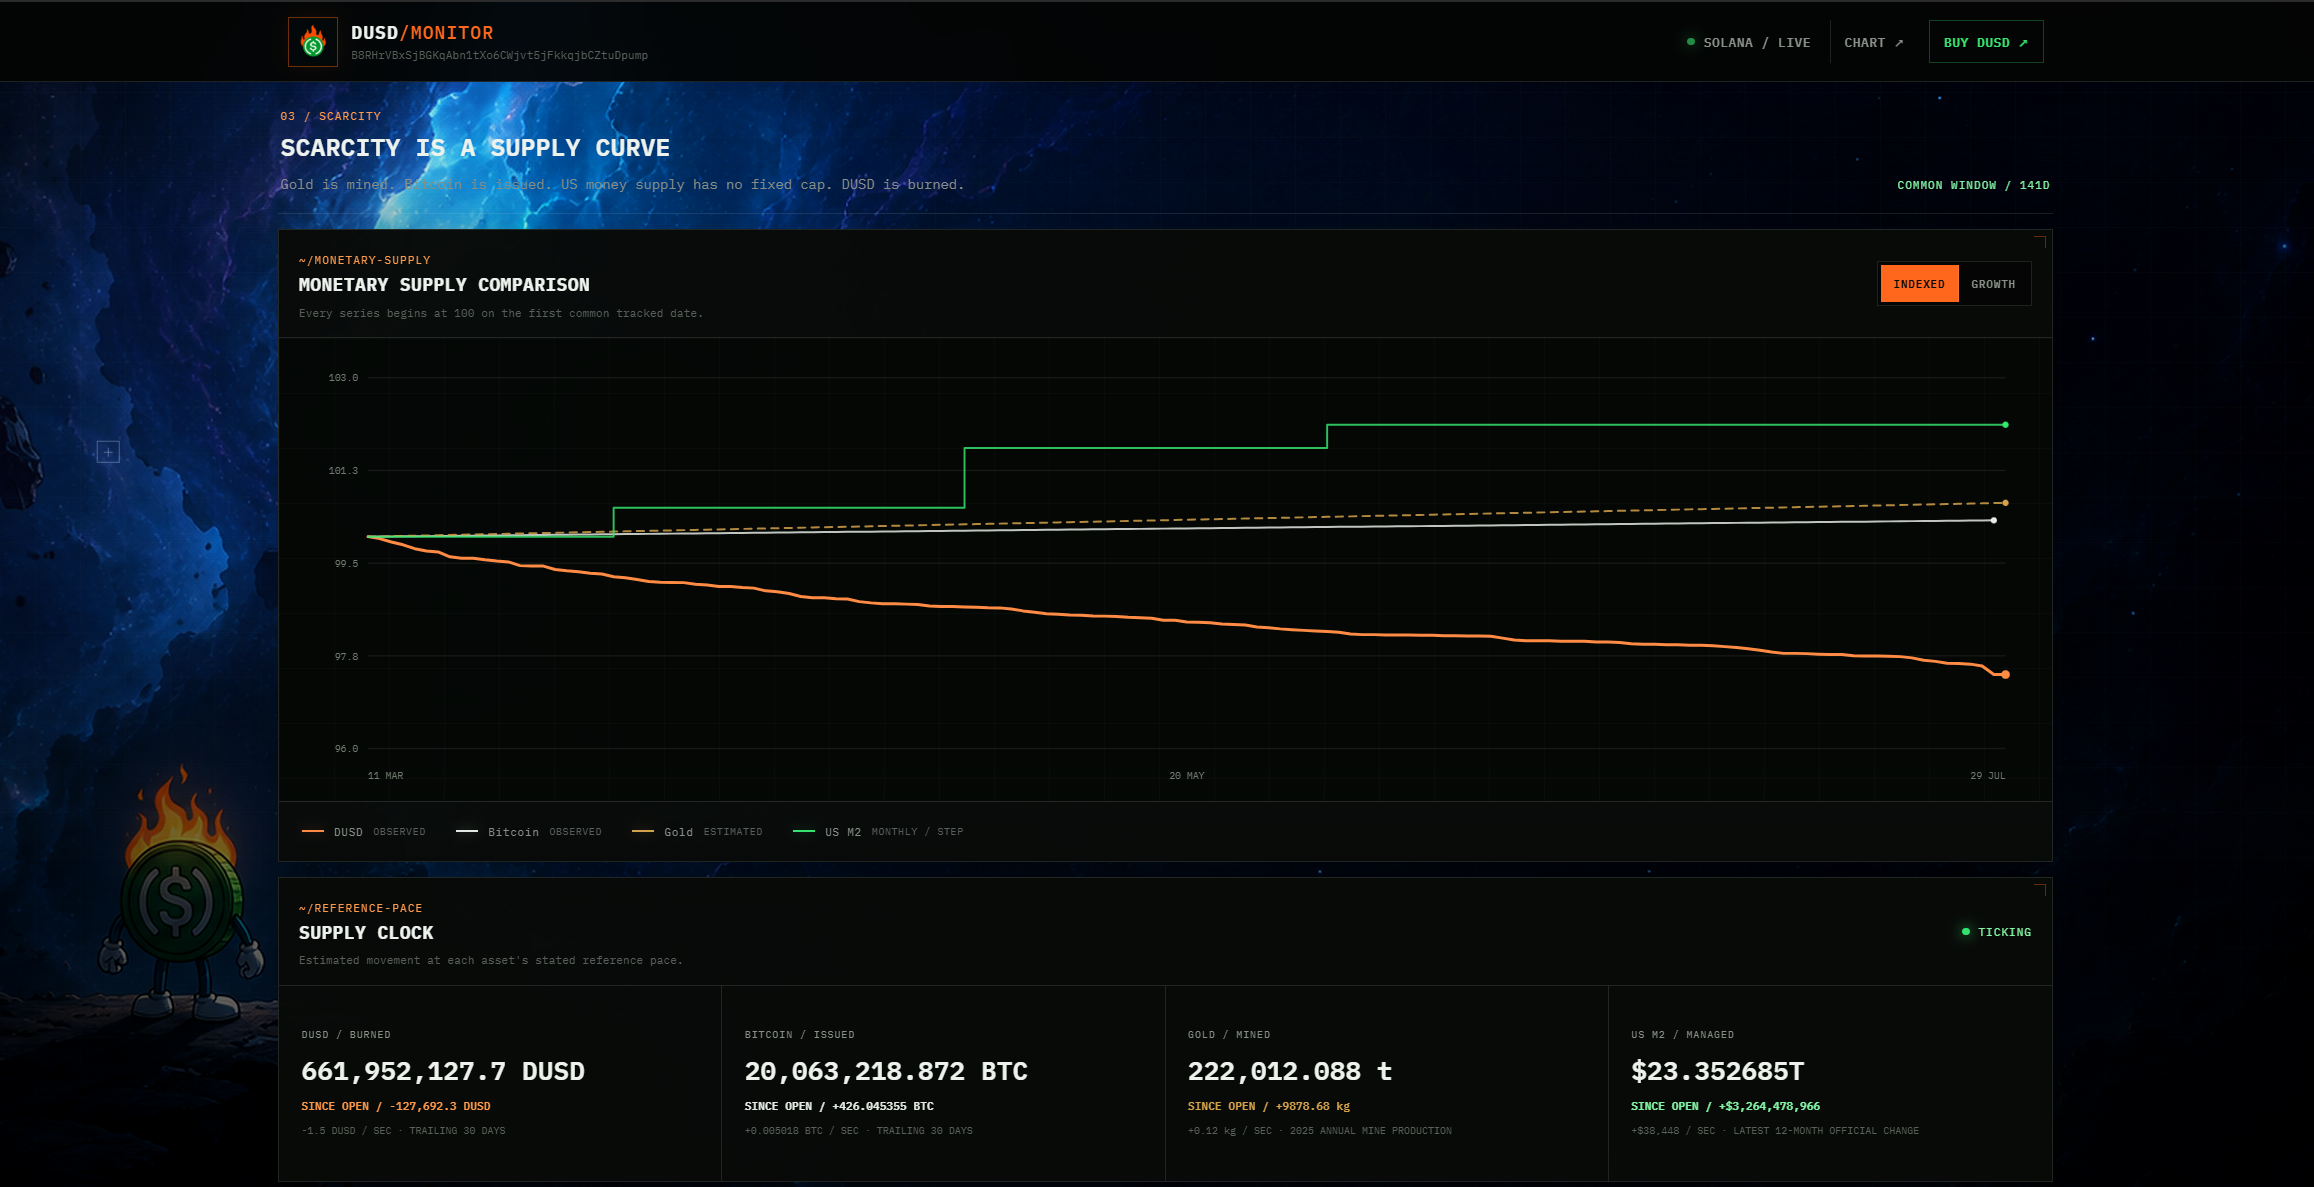
Turning an abstract scarcity claim into an observable comparison across monetary systems.
The interface turns supply mechanics into a product users can inspect, compare and revisit.
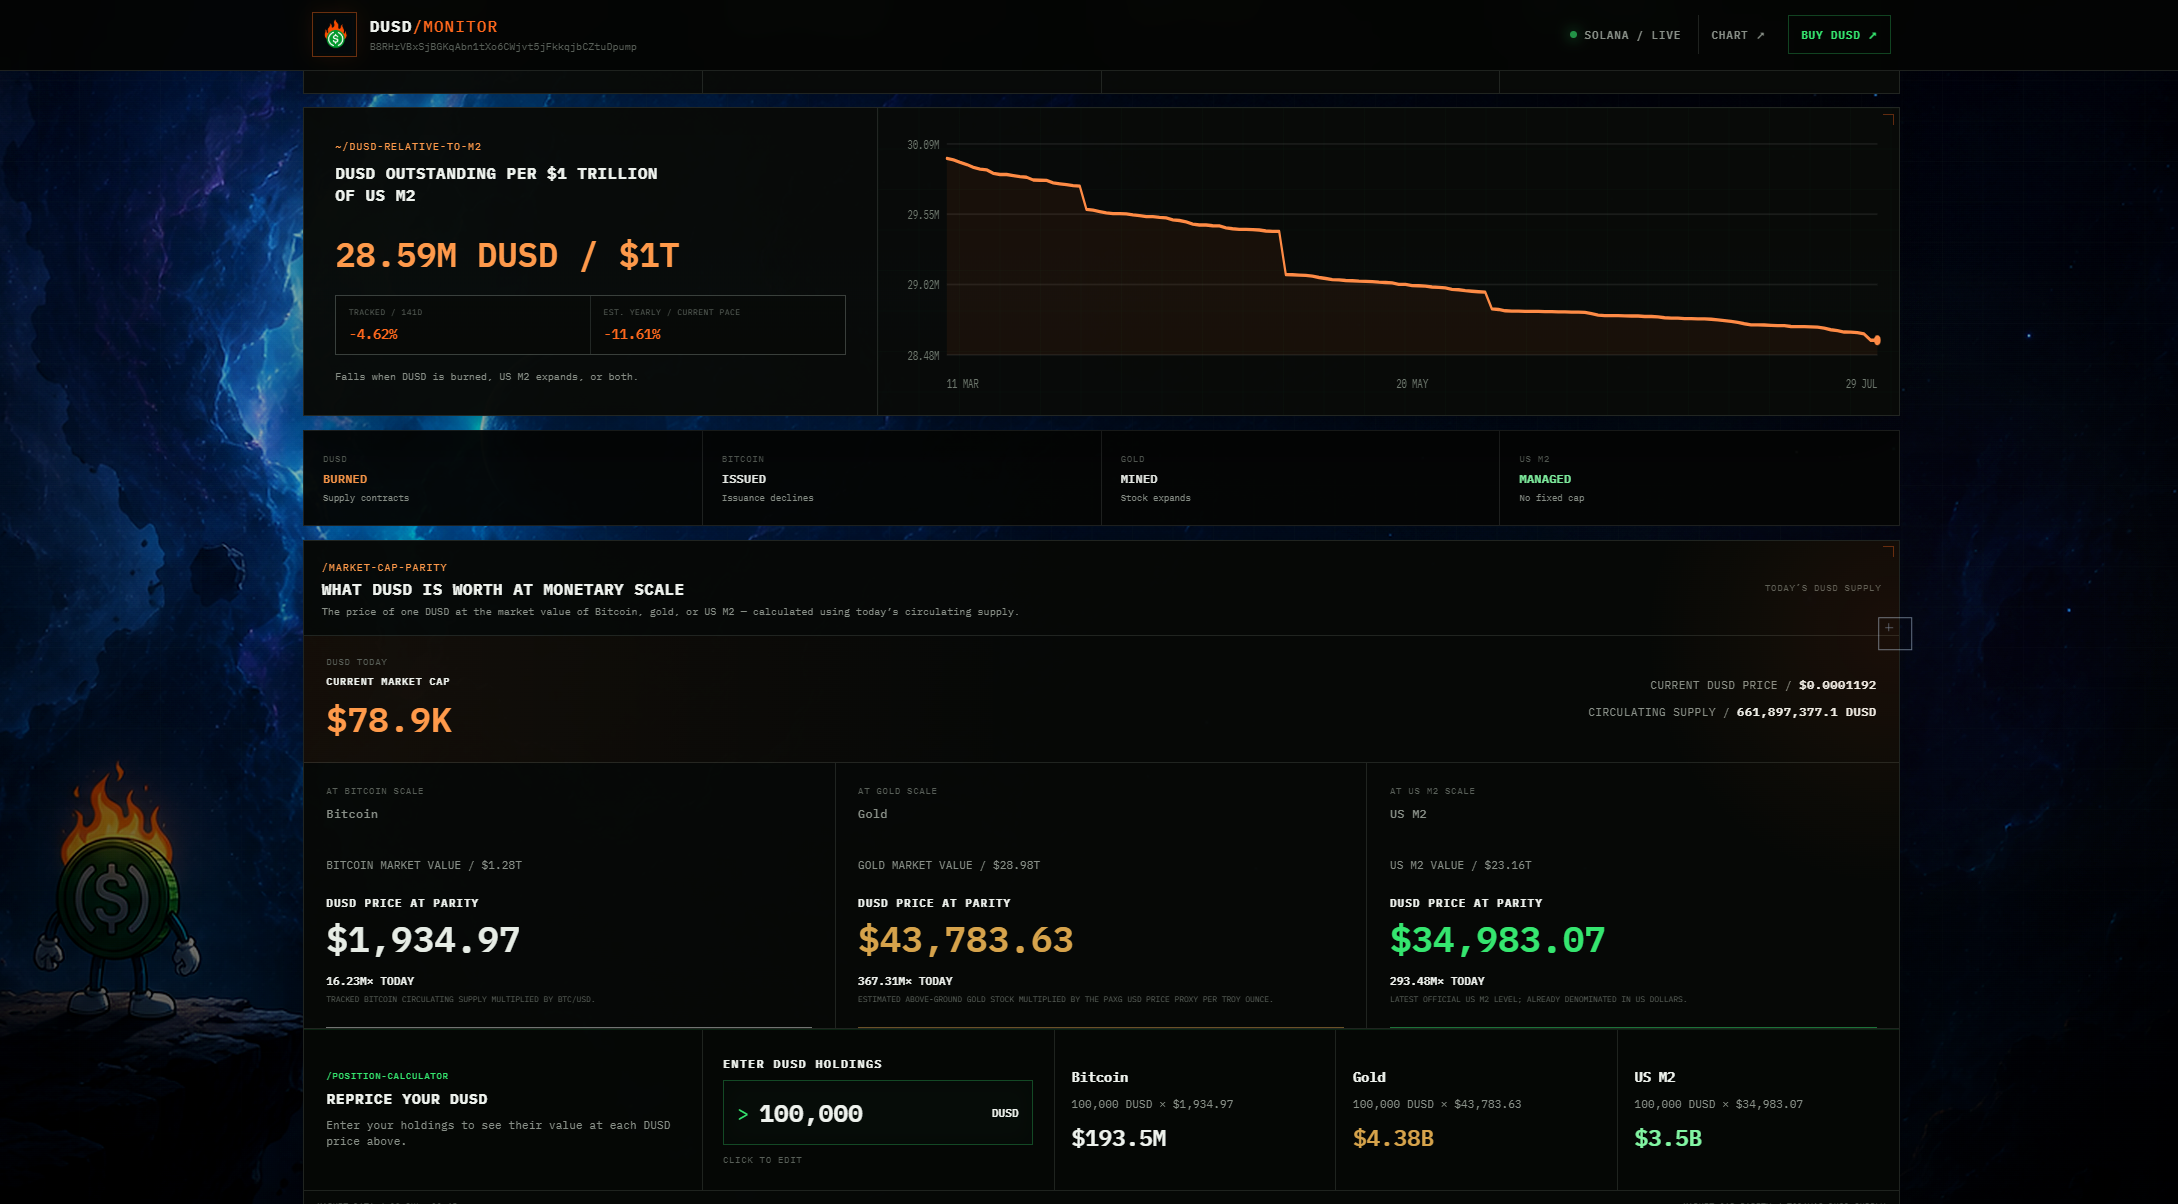
Interactive tools for exploring scale and supply dynamics—not price forecasts.
PRODUCT AND SYSTEM DESIGN
Designing trust into a speculative market
The interface was designed to turn a highly speculative context into a more inspectable information product.
Real data over promotional claims
The interface centres verifiable burns, transaction signatures, supply changes and sourced comparison data.
Storytelling through systems
Live counters, indexed charts and supply comparisons express the scarcity narrative without relying on long marketing copy.
A deliberate product hierarchy
The experience moves from current supply and market activity into long-term scarcity, transaction evidence and participation.
A distinctive visual identity
Terminal styling reflects the live, on-chain system while retaining the structure of a serious analytics product.
Conversion without becoming an advert
Market charts, trading routes and community pathways remain accessible while the analytical product stays central.
- 01Indexing and calculation↓
- 02Live product interface↓
- 03Understanding · Participation · Community
POSITIONING
From supply mechanic to repeatable public narrative
DUSD.fun transforms recurring on-chain activity into evidence of contraction, live market intelligence, comparison with other monetary systems and a coherent public identity.
The analytical surface remains central, while market charts, trading routes and community pathways provide clear next steps without turning the experience into a generic token advert.
PRODUCT STRATEGY
The website became the product layer
The wider community operates across social channels, trading venues and blockchain transactions. DUSD.fun gives that activity one coherent public surface.
- Defined the product narrative around observable supply contraction
- Selected the metrics that made the mechanism understandable
- Turned community activity into structured public information
- Connected technical data with market storytelling
- Maintained and evolved the product as the market changed
- Built a product that generates new information through each burn
Most memecoins depend on continuously inventing new attention. DUSD already produced an event stream through every buyback and burn; the product was designed to make that stream visible.
I created and operate DUSD.fun, the product and analytics layer for the wider community-run project.
WHAT THE PROJECT DEMONSTRATES
One independently operated product system
Independent product ownership
Strategy, design, development, data and ongoing operation.
Technical execution
Blockchain, market and monetary data translated into a responsive live web product.
Information design
Complex supply and market dynamics made legible through hierarchy, interaction and visualisation.
Commercial positioning
A differentiated narrative and repeatable destination built around a live market mechanism.
DUSD.fun demonstrates how a small underlying mechanism can become a much stronger product when data, design, narrative and technical execution are treated as one system.